I’ve previously posted on the recent report on inequality by the government-sponsored National Equality Panel (NEP).
The report reworks a graph on income inequality to give a more favourable impression of trends. A large portion of total income inequality is also left unexplained by the report. This is so-called ‘residual inequality’.
The NEP report bases its analysis on a detailed decomposition analysis by the Institute for Fiscal Studies (IFS). Not to be confused with a study of dead bodies, the analysis looks at inequality trends over some forty years from 1968. It breaks down (‘decomposes’) the trends into a number of factors that may have contributed to changes in inequality. It also looks at the relative importance of these factors. It’s an impressive piece of work: professional, serious-minded and transparent. In other words it is unlike much of the half-baked twaddle that all too often passes for government-backed ‘research’.
According to the IFS team between a quarter and a third of total income inequality during the forty year period they studied could be attributed to employment status and occupation. Family structure (i.e. number of parents; number of children) was also a factor, though a declining one through the period. Age, ethnic group and the region someone lived apparently had a negligible impact (the detailed figures are in table 24, page 59 for those who want to look at them).
Most of the inequality, however, they could not explain. This ‘residual’ portion accounted for 57 percent of total inequality in 1968, rising to 63 percent by 2007. This state of affairs is, they write, ‘somewhat disappointing’. Quite. They have a go at explaining what might make up this ‘residual’ portion, suggesting that educational differences play a part:
Education has also played a significant role in inequality changes in the 1980s… This effect was relatively small, however, explaining around 12% of the inequality increase between 1978 and 1988. The relatively small size of this effect may reflect the rather limited data on education that we have available. Since these changes accompany large increases in the residual, it would be very reasonable to believe that a significant portion of this residual reflects unobserved education effects, such as the quality of qualifications received.
I guess this is fair enough as far as it goes. But couldn’t other factors – employment characteristics or region for instance – also be undermeasured? And what does ‘a significant portion’ mean? They don’t elaborate.
If education was a significant underlying factor in income inequality growth we would expect to see the biggest gap opening up between those on middling incomes and those on low incomes. But that is not what the IFS study finds, as the following graph, from page 99, shows:
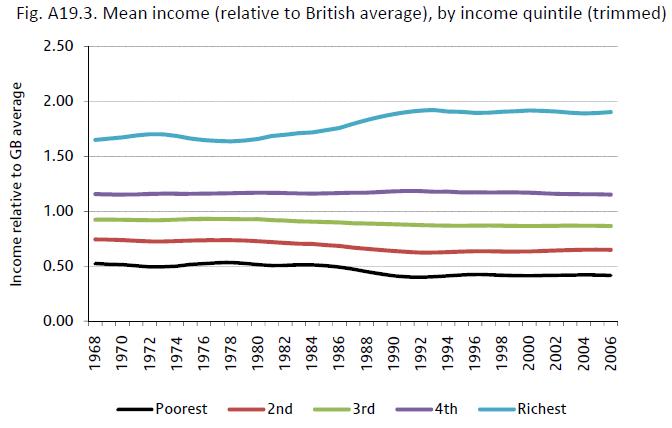
Income relative to the average stood still, or declined, for all groups apart from the richest 20 percent. During this whole period, in other words, there was an accumulation upwards of wealth, rather than the emergence of a new, better educated, middle class that pulled away from the poorest groups.