We’ve been hearing a lot in the news recently about a ‘surge’ in knife crime, so let’s have a look at the data and see what’s going on.
We’ve been hearing a lot in the news recently about a ‘surge’ in knife crime, so let’s have a look at the data and see what’s going on.
When you hear people talking about ‘knife crime’ they aren’t actually referring to a specific offence; ‘knife crime’ refers to a collection of serious violent and sexual offences where a knife has been used which have come to the attention of the police, and that the police have recorded.
Police forces began separately identifying offences involving a knife in the year ending March 2008. The extension of the number of offences covered, as well as recording changes, means a consistent time series is only available from the year ending March 2011.
Offences included in overall knife crime figures are: homicide, attempted murder, threats to kill, assault with injury and assault with intent to cause serious harm, robbery, rape and sexual assault. These are presumed to encapsulate most offences involving a knife.
Figure 1 shows trends in knife crime since the year ending March 2011. You can see that levels of knife crime fell from 2011 to 2014, and have risen by about three fifths since then. There were roughly 40,000 knife crime incidents in 2017/2018, the highest number of any year since these records began.
Figure 1: Total selected offences involving knife or sharp instruments in England and Wales, year ending March 2011 to year ending March 2018.
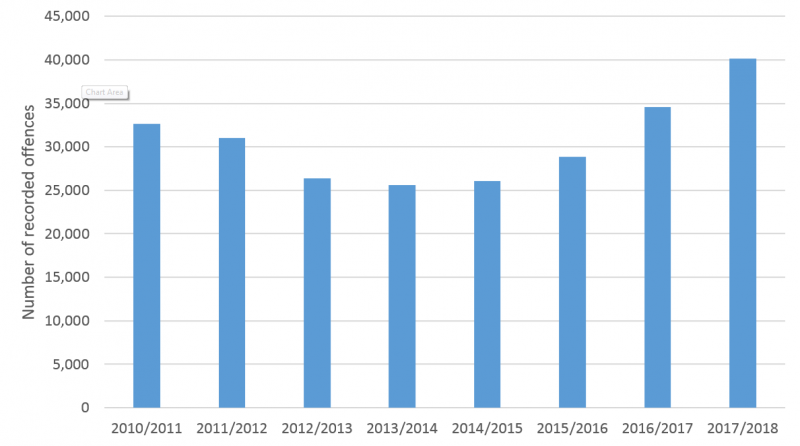
Source: ONS (2018) Crime in England and Wales, year ending March 2018: Other related tables, Table F3.
Police recorded crime figures can be affected by changes to recording practices, rates of reporting, and police activity, meaning trends in police recorded crime statistics do not necessarily reflect those in the real levels of the offences they purport to capture.
Recorded crime figures lost their official statistics status in the year ending March 2014. Improvements in recording by local forces are said to have contributed to some of the rises in recorded crime observed in recent years.
Although lower-volume, higher-harm offences such as those involving a knife or sharp instrument are thought to be better recorded than higher-volume, lower-harm offences, it is still thought that better recording by police forces contributed to the increase.
Knife homicides show a less marked rise, but have risen sharply over the last year
There are particular data we can use to try to validate the general trends in the police recorded crime figures. Homicides, which are included in the overall knife crime figures above, are thought to be very well recorded (killings almost always come to the attention of the police and they record them as such).
Figure 2 shows that the trend seems to largely mirror the trend in overall knife crime, albeit with a less marked increase of two fifths since the 2014/15, the year with the lowest levels of knife homicides. There is a very sharp rise in homicides between 2016/2017 and 2017/2018, with these deaths increasing by a quarter in only a year.
Figure 2: Homicides involving a knife or sharp instrument in England and Wales, year ending March 2011 to year ending March 2018.
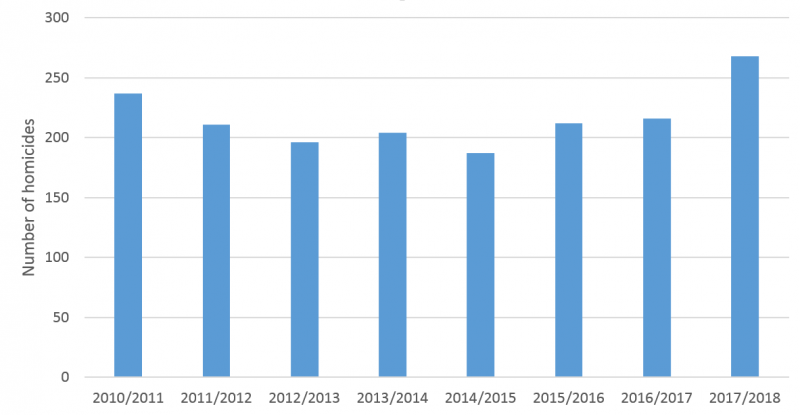
Source: ONS (2018) Crime in England and Wales, year ending March 2018: Other related tables, Table F3.
Crime survey not a reliable source for trends in knife crime
The Crime Survey for England and Wales (CSEW), which asks households about their experiences of crime victimisation, provides more reliable estimates of the number of higher-volume, lower-harm offences each year because it does not rely on them coming to the attention of the police.
Volatility in estimates of lower volume phenomena like knife crime, inherent to any survey data, mean the CSEW is not seen as a reliable measure of trends in knife offences.
More reliable hospital admission statistics show a steep rise but not as steep as police data
Like incidents recorded by the CSEW, admissions to hospital for assault by sharp object do not rely on them coming to the attention of the police, and are thought to be well recorded because if someone is seriously injured they will require professional medical care.
Figures for admissions to hospital do not include cases where somebody attends an accident and emergency department with stab wounds, but is not subsequently admitted to hospital; they only cover the most serious instances of wounding.
Figure 3 shows data on the number of finished consultant episodes for assault by a sharp object since 1998/1999. Recent trends seem to approximately mirror those in recorded knife crime and knife homicides, with an increase of around two fifths since 2014/2015, the year which saw the lowest levels in this set of data. It’s worth also pointing out that the number of hospital admission for assault by a sharp object were higher in 2006/2007 than they were in 2017/2018.
Figure 3: Number of finished consultant episodes* for assault by sharp object in England and Wales, year ending March 1999 to year ending March 2018.
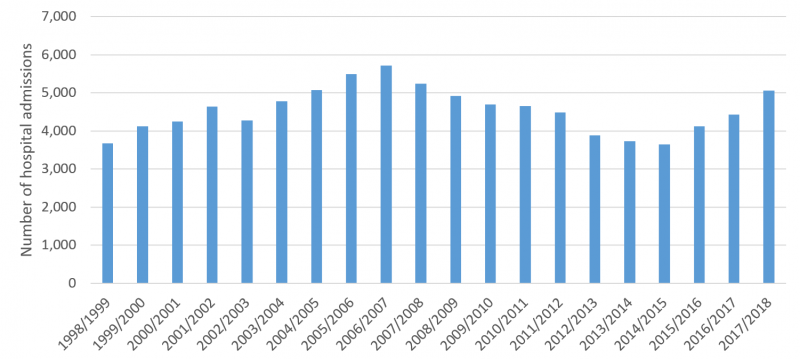
*A finished consultant episode (FCE) is a continuous period of admitted patient care under one consultant within one healthcare provider. FCEs are counted against the year in which they end. Figures do not represent the number of different patients, as a person may have more than one episode of care within the same stay in hospital or in different stays in the same year.
Source: Allen and Audickas (2018) Knife crime in England and Wales: Supporting Excel tables, C. 13.
So is there a surge?
We can say for certain that the most serious forms of knife violence, represented by the homicide and hospital admission data, have seen a significant increase in a relatively short amount of time. This might also suggest that the increases in police recorded knife crime overall reflect increases in the levels of this type of violence, but the increases may be less steep than the police data indicates.
A word on geography
Knife crime isn’t evenly distributed among different areas. In 2017/2018 around 60 per cent of all recorded knife crime incidents occurred in only six of the 43 territorial police forces and the British Transport Police in England and Wales, and 37 per cent occurred in London alone.
Even after controlling for the different sized populations among police forces there was a lot of variation in rates of knife crime. Surrey had the lowest rate, with only five incidents per 100,000 population in 2017/2018, and London had the highest rate, with 168 incidents per 100,000 people.
Although all but three police forces saw increases in recorded knife crime since 2012/2013, the increase ranged from 23 per cent to 189 per cent. As explained above, some of this will be down to improvements in recording, but the differences in the rises in real levels means the ‘surge’ in knife crime will make more sense in some areas than others.
So what?
Obviously the extent of the increase isn’t really relevant; the only acceptable level of knife violence is no knife violence. The important question is what factors determine levels of knife crime and what strategies are most effective in preventing it? Our report, Young people, violence and knives - revisiting the evidence and policy discussions, attempts to address these questions.