This article gives a little background about young people living in Britain. Most of the material is drawn from the chapter on young adults in Identity in Britain (Thomas and Dorling, 2007), an atlas of life for various age groups in early twenty-first century Britain.
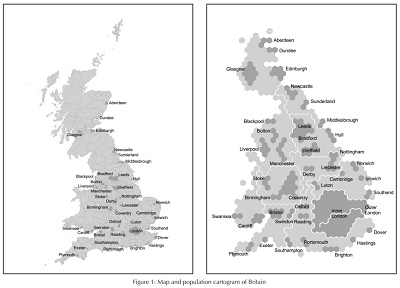
To start, a note about the maps, which are population-based cartograms. Each area is sized roughly according to its population; enabling the centre of cities to be distinguished. As can be seen from Figure 1, it is impossible to see the variation that occurs in central London on the traditional map, in comparison to the picture shown by the cartogram. The areas shown on the cartograms are neighbourhoods, each neighbourhood being half a parliamentary constituency. Each hexagon represents a constituency; each neighbourhood is represented by a half hexagon. As an aid to navigation, the location of some cities and towns are included on the cartogram. The outlines of these urban areas are shown on all the cartograms that follow. Detailed location maps can be found at www.sasi.group.shef.ac.uk/publications/identity/online_ appendix.pdf.
The years of young adulthood are a time of transition, when people begin to make decisions for themselves rather than following the choices and constraints of their parents. Going onto post compulsory education, entering employment, getting married, becoming a parent, doing nothing: the years of young adulthood, from 16-24, offer a myriad of opportunities. But what young people go on to do is often constrained by where they live and where they grew up. Not all young adults have the same opportunities; some factors such as poor health or limiting long-term illness can constrain their choices. Some stay in the area where they grew up while others move to other places for education or employment. The maps that follow tend to show a familiar pattern, of a North-South divide: young people living in Scotland, Wales, and the northern part of England tend to have different trajectories from those living in the South of England, and particularly the South East region. And this North-South divide reflects the North-South pattern that we see when we look at their parents’, grandparents’, and possibly great-grandparents’ lives.
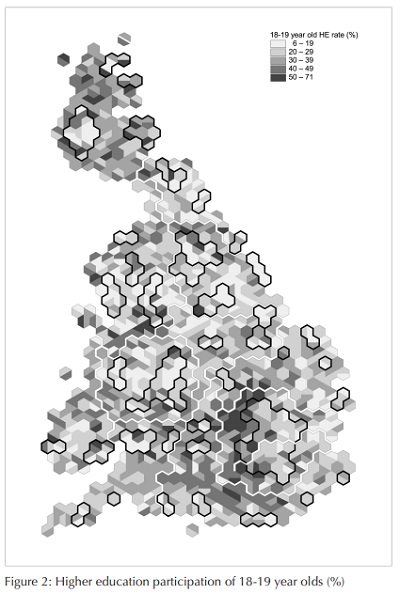
Figure 2 shows the proportion of 18 and 19 year olds entering higher education (which includes higher education delivered in further education institutions) between 1994 and 2000. There is a noticeable arc of high participation around North and North West London, while many of the old midland and northern industrial areas have much lower rates. Not all universities are the same, and although it is not mapped here, the picture shows even more of a divide of those young people attending the most elite institutions – those institutions that admit a tenth of students in total and admit the highest proportion from the highest participating areas. This elite group corresponds to the equivalent of the North American Ivy League and includes most of the ancient universities, and the highest proportions of young people attending such institutions are from the South East and the eastern half of Scotland.
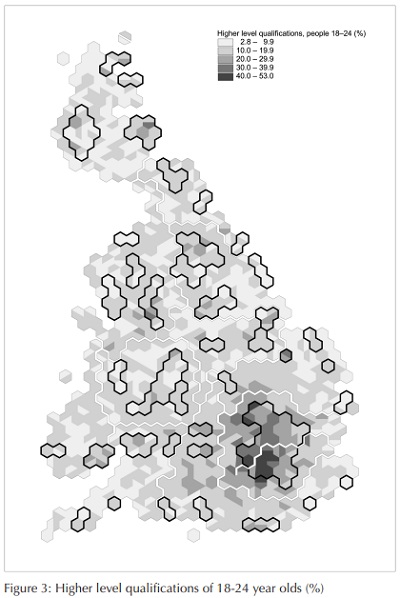
Figure 3 shows where the young people who have obtained their degrees (or further degrees) are living. It maps the proportion of 18- 24 year olds with higher level (degree or above) qualifications at the time of the 2001 Census. Many young adults who grew up in the neighbourhoods from which the highest proportions go to university have moved to London, reflecting the migration of young graduates to the capital to find suitable work and embark on their careers. The only places outside of London where over 30 per cent of young people have higher level qualifications are found in Cambridge, Manchester, and Edinburgh.
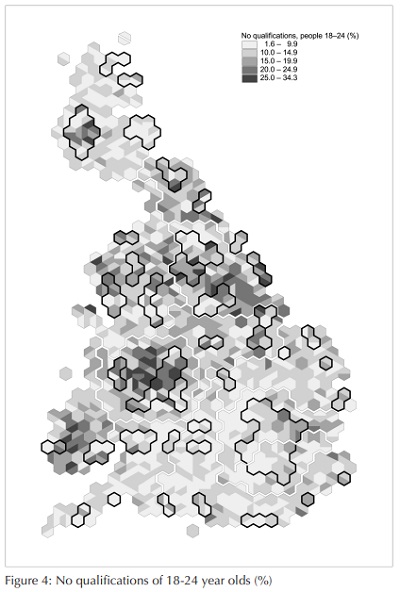
In comparison, Figure 4 shows the proportion of 18-24 year olds with no qualifications, also at the time of the 2001 Census. The familiar North-South divide is repeated here, with the exception of Scotland (apart from parts of Glasgow), which has a different education system from England and Wales. There are concentrations of young people with no qualifications in South Wales, Manchester, South Yorkshire, Newcastle, and Glasgow: many of the areas where the old blue-collar industries did not (particularly for young men) require qualifications, and where the low-skill jobs that have replaced them also require few qualifications. And many of those who have gained qualifications have left these areas for places where there are more jobs commensurate with those qualifications. It is, however, disheartening that with the emphasis on education and the demand for an educated workforce that over a third of young people in some neighbourhoods have not obtained a single GCSE.
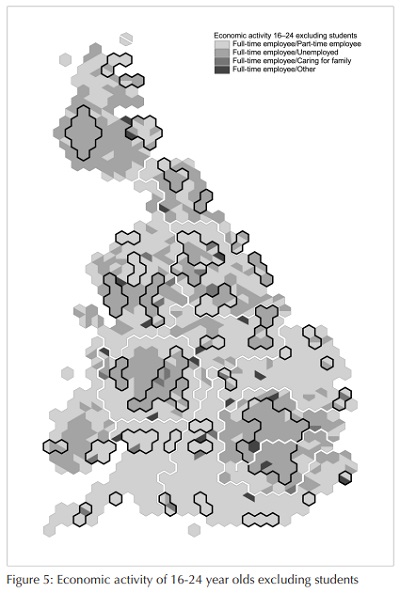
For all young people, the most common form of economic activity is either full-time employment or studying. Figure 5 shows the most common (before the slash in the key) followed by the second most common (after the slash) economic activity of 16-24 year olds excluding students, as reported in the 2001 Census. Full-time working is the most common economic activity of those 16-24 year olds who are not students, with part-time work as the second most common economic activity in the South East and much of rural Britain. In comparison, in urban areas, the most common economic activity is full-time employment and the second most common, unemployment. The occupations of those in work are for the most part in sales and customer service positions and elementary, unskilled jobs. Of course, young people of these ages have not been in employment long enough to have progressed far up the career ladder. Many of those in more skilled jobs such as associate professional and technical professions – which often necessitate higher level qualifications – are found in and around London, living much closer to their workplaces. In only a few places is the second most common activity, after full-time work, caring for family—reflecting the generally low rates of parenthood for this age group. Much less than a tenth of young adults are parents in much of southern England. Nowhere are many more than a fifth of young adults parents. It was not so long ago that it was usual for this age group to be parents.
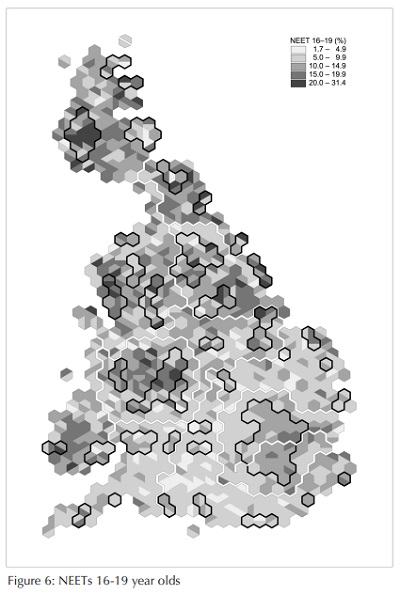
Turning from those in work to those who are not, Figure 6 shows the estimated proportion of 16-19 year olds who were NEETs – not in education, employment, or training – around the time of the 2001 Census. The highest rates are found in the old industrial areas of the midlands and northern England, South Wales, parts of East and South London, and the central lowlands of Scotland, with much of Glasgow having over a quarter of its 16-19 year old population falling into this category. With government initiatives such as the September Guarantee for young people and the raising of the school leaving age, it is to be hoped that the number of NEETs should decline in the future.
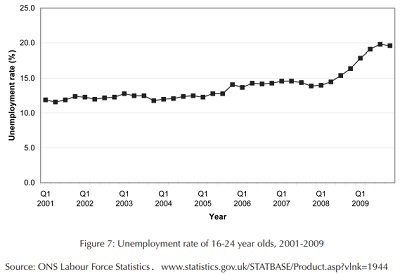
Much has of course changed since the tables and maps in Identity in Britain were created. The number of young adults has increased with the arrival of young people from the A8 accession countries; the recent recession has had a disproportionate effect on unemployment rates of 16- 24 year olds as can be seen in Figure 7. The seasonally adjusted rate in the first quarter of 2001 was 11.9 per cent and had increased to 19.6 per cent by the last quarter of 2009. To put this in context, 16-24 year olds comprise approximately a fifth of the working age population but account for about two fifths of the unemployed. Many of the 18 year olds who have decided to go onto higher education have been disappointed as supply has not been increased to meet the increased demand; and many of those are likely to have added to the unemployment figures.
It can safely be assumed that things are going to get worse for all of us over the coming few years. It can also be assumed that young adults are likely to be hardest hit in terms of unemployment and the increased demand for further and higher education not being met due to savage cutting of post-compulsory education budgets. We can further assume that those young people who are NEETs now are likely to remain mostly benefit-dependent for a long time to come, if not for the rest of their lives. We must remember that all of this is likely to apply even more harshly on those living in the areas where they previously did less well on all these measures. Mapping the variables shown here in the future will almost certainly reveal an even starker divide.
Bethan Thomas is a Research Fellow in the Department of Geography, University of Sheffield.
Reference
Thomas, B. and Dorling D. (2007), Identity in Britain: A Cradle-to-Grave Atlas, Bristol: Policy Press.