We did not want to enquire too closely when the Government announced its support for ‘evidence-based’ policy-making. After the long years of having criminological research ignored, under-valued and under-funded by the Conservatives, we were not inclined to be picky. So, like drifting mariners, many of us succumbed to the siren call of the Home Office for independent evaluation of its Crime Reduction Programme. I like to think we had some honourable motives: a desire to support the application of knowledge to social progress, perhaps? I also like to think we trusted our Government, whose promises of reform appeared to merit support. Along with some of my academic colleagues, we have published our various accounts of our evaluation experiences in a special issue of the journal Criminal Justice (Volume 4 (3), 2004). For my part, it was with sadness and regret that I saw our work ill-used and our faith in government's use of evidence traduced.
Yet, though I have been sorely tempted at times, I do not want to pin the blame entirely on the mendacity of political culture, or the self-interests of the various coteries who swarm around politics (Hope, 2004). In many ways, I do not think either politicians or their advisers could help themselves resist temptation. Rather, the blame lies with an incompatibility between the ideology of evidence-based policy and the natural inclination of the political process to want to secure the best outcomes. Given the power of politics, it is not rocket science to predict what will happen when evidence gets in the way of a good policy. Recently, Tony Bottoms has written that ‘methodology matters’ (Bottoms, 2005). It matters because methodology, complicated and tedious though it might appear, is the only way in which science can rescue, defend and indeed empower evidence within the political claim-making about ‘what works’ And methodology ought to matter, as it does to scientists, because it is the only way in which the validity of the evidence itself can be held to public account.
Writing more than thirty-fi ve years ago, at the crest of another wave of evidence-based policy-making, the eminent American social scientist Donald T. Campbell (1969) wrote a famous paper justifying the application of rigorous research methodology to the evaluation of policy. His chief justification was to protect the public interest against what he called ‘trapped administrators’ – politicians in power who become trapped by their own rhetoric and promises into claiming success for their policies in advance of the evidence. Trapped politicians are well disposed to pretend that policies work even in the face of evidence to the contrary. But Campbell was also aware of certain statistical artefacts (which have been apparent since the foundation of statistical reasoning in 19th century) that could be turned to advantage by the trapped administrator.
The best odds for the trapped administrator are where you can get away with capitalising on chance: for instance, the greater chance that if the probability of something is already declining over time it will continue to do so rather than abruptly change direction; or the phenomenon of ‘regression toward the mean’ (RTM) – that if something observed at one time is extreme, it is more likely the next time to be less rather than more extreme, and vice versa (Yudkin and Stratton, 1996). This is especially likely to be so when, truthfully, you have little understanding of the underlying causes of a problem that makes its trend go up or down or vary from place to place, and so you are unable to make an honest prediction of ‘what works, especially for whom, and in what circumstances. The best bet, as Campbell put it, is to pick “the very worst year, and the very worst social unit … there is nowhere to go but up, for the average case at least” (Campbell, 1978, p. 87).
The coincidence between statistical artefact and the promises of the trapped administrator is unfortunate: even if you don't understand (or even care) what causes a crime rate to vary, let alone understand RTM and other statistical obscurities, as a politician you are more likely to be tempted to select the evidence that appears to support your belief than that which contradicts it. And if you are at pains to protect simple, honest folk from the black arts of research methodology – after all, practitioners don't want to be confused by the ifs and buts of research, they want to get on with job, don't they? – then, conveniently, neither they nor anybody else is going to be able to contradict your own desire to present evidence in the best possible light. Indeed, you may even dupe yourself.
Various evaluation research methodologies have emerged over the years to overcome or discount effects due merely to statistical artefact, including experimentation and regression-based statistical analysis. Yet the risks of erroneous inference due to selective and artefactual bias inherent in seemingly simpler research analyses continue to be ignored (see Hope, 2002). By way of illustration, take the results of two local projects from my research consortium's own evaluation of part of the Home Office Reducing Burglary Initiative – Phase 1, contained in Table 1 (for further information see: Hope, 2004; Hope et al.,2004).
Table 1: Impact of two local burglary prevention projects on burglary (percentage change) (see Hope 2004).
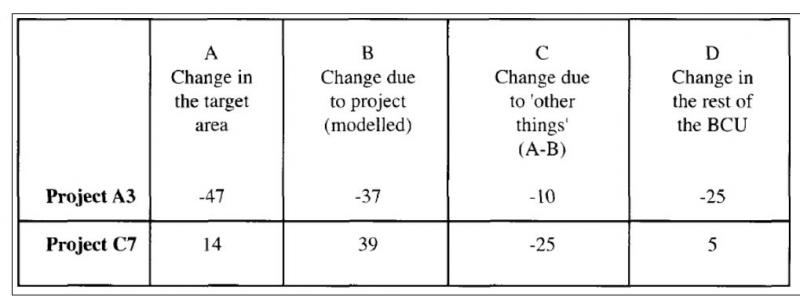
Recorded burglary offences almost halved during the course of Project A3, while they increased by 14 per cent in the Project C7 area (column A). We employed a regression-based, time-series statistical method to estimate the proportion of change in burglary, over and above the general trend in each area, that could be attributed to the impact of the project itself. The same method produced very different estimates: for Project A3, we estimated that, if the only thing affecting the trend in burglary in each area had been the projects themselves, Project A3 would have reduced burglary by around a third, while Project C7, left to its own devices, would have actually increased burglary by two-fifths (column B). As it happened, other (non-project) influences on burglary in each of the areas served, presumably, to moderate the projects’ effects: rather embarrassingly, the efforts of Project C7 appear to have off-set an otherwise generally favourable burglary reduction trend (column C).
Even though our method suggested that two of the other projects we studied could have produced even greater reductions, the Home Office selected from our case-studies only project A3 to write-up for practical benefit (Home Office, 2004a). Presumably, this was because the area-wide reduction was greater here than elsewhere (Hope, 2004, Table 1), Even so, the Home Office write-up has a rather different narrative from our own submitted site-report, the former conforming to an officially-endorsed descriptive framework known as the Five-Fs (for more of our own details see Hope, 2005). Publicly, the Home Office has never commented on Project C7, which clearly remains something of an embarrassment. Not only does it seem that an official project could have let burglary increase but, at the outset, a Home Office consultant had described the project as ‘straight-forward, in conception. Of all our projects, this one was focused most specifically on the target-hardening of individual dwellings to reduce repeat victimisation (ibid) – an officially-endorsed burglary prevention strategy, carried out by a police service that had gained a national reputation for this kind of crime reduction work.
Instead, the Home Office published its own, pre-emptive analysis of the impact of the projects (Kodz, et al., 2004; Kodz and Pease, 2003). This used a ‘simpler’ method to estimate impact, merely comparing the rate of change in the project target area with that occurring in the remainder of the police Basic Command Unit (BCU) in which the project was located, and combining together results of all the projects studied by each of the three evaluation consortia. Through various manipulations of the data, the Home Office method does what it can to capitalise on chance, producing much more favourable findings overall (Hope, 2004). But for individual projects, the method produces considerable distortion. Ironically, this method under-estimates the likely positive impact on burglary of Project A3 (Table 1); and although for Project C7 we now are presented with smaller numbers, these cannot disguise the three-times greater increase in the target area (column A) than in the rest of the BCU (column D).
Lest it be thought that such practices are confined to the management of a particular political programme, let's take a look at the current Home Office Public Service Agreements. Number One on the list is to “reduce crime by 15% and further in high crime areas, by 2007-08” (HM Treasury, 2004). Going by what I have just said, this doesn't look like such a bad bet; not only has crime been going down steadily but RTM would suggest that we can rely on getting bigger reductions in the high crime areas too. Indeed, it is in the top 40 (but why 40?) CDRP (Crime and Disorder Reduction Partnership) areas in 2003/04 that the Home Office is looking for greater than average reductions over the period, compared to the remaining 336 CDRP areas (Home Office, 2004b). Of course, by the same reasoning, particularly if you are not actually doing anything effective, the odds are just as likely of getting less than average reductions in the lowest crime areas (but let's not talk about that).
Even so, it might not be as easy as it looks–chance is fickle after all. Thus, for example, even if we could show that crime rates this year had reduced in what were the highest crime areas last year, that would not necessarily mean that the gap between the highest and lowest areas this year was any less than it was last year; after all, RTM suggests it is likely that other areas may have taken their respective places this year. Reducing the ‘performance gap’ actually means doing something to affect the distribution of performance as a whole, across all the partnerships, since the catch in RTM is that reductions towards the mean are compensated in similar magnitudes by increases.
We shall have to wait and see whether the performance data released publicly allows us to assess whether any real, rather than artefactual, reductions in crime have occurred. But when I say ‘us, I don't mean the electorate, of course. For most citizens, everyday life is increasingly resembling a lottery. By the same token, supporting government policies these days is like taking a trip to the betting-shop. But if that is the way we are to be governed, do we not have a right not only to know how to calculate the odds but also whether to trust the bookmaker? And are criminologists becoming merely the tipsters of the new crime reduction sweepstakes?
Tim Hope is writing in his capacity as Professor of Criminology at Keele University. The views here do not reflect necessarily other commissions in which he is engaged currently.
This article is republished from Issue 62, December 2005 of Criminal Justice Matters
References
1. Bottoms, A. (2005) ‘Methodology Matters’, Safer Society, Summer, 10-12. London: Nacro.
2. Campbell, D.T. (1969, 1978) ‘Reforms as Experiments’, American Psychologist, vol. 24, 409–29, 1969. Reprinted in J. Bynner and K.M. Stribley (eds.), (1978) Social Research: Principles and Procedures. London: Longman/Open University. [
3. HM Treasury (2004) SR 2004: Public Service Agreements, chapter 6. London: Home Office. 12 July 2004 (www.hm-treasury.gov.uk/spending_review/spend_sr04_psaindex.cfm).
4. Home Office (2004a) Reducing Burglary Initiative Project Summary, Stone ferry, Hull, Supplement 10 to Findings 204. London: Home Office.
5. Home Office (2004b). SR 2004 PSA Targets: Technical Notes. London: Home Office, (www.homeoffice.gov.uk/documents/homeoffice_sr04_tns.pdf).
6. Hope, T. (2005) ‘Sustainability in Crime Prevention: a Nautical Tale’, International Observer, Edition 36, March 2005. Montreal, Canada: International Centre for the Prevention of Crime (http://www.crime-prevention-intl.org/io_view.php7io_id=117).
7. Hope, T. (2004) ‘Pretend it Works: Evidence and Governance in the Evaluation of the Reducing Burglary Initiative’, Criminal Justice, 4 (3), 287–308.
8. Hope, T. (2002) ‘The Road Taken: Evaluation, Replication and Crime Reduction’, in G. Hughes, E. McLaughlin and J. Muncie (eds.) Crime Prevention and Community Safety, London: Sage Publications.
9. Hope, T., Bryan, J., Crawley, E., Crawley, P., Russell, N. and Trickett, A. (2004), Strategic Development Projects in the Yorkshire and the Humber, East Midlands and Eastern Regions, Home Office Online Report 41/04. London: Home Office.
10. Kodz, J., Pease, K., and Stephens, M. (2004), Explanatory Note for Online Reports OLR 40/04 to OLR 43/04, Home Office Online Report 39/04.
11. Kodz, J. and Pease K. (2003), ‘Reducing Burglary Initiative: Early Findings On Burglary Reduction’, Findings 204. London: Home Office.
12. Yudkin, P.L. and Stratton, I.M. (1996), ‘How to Deal with Regression to the Mean in Intervention Studies’, The Lancet, Vol. 347, 241–243. doi: 10.1016/S0140-6736(96)90410-9